Differentiate Groups using Univariate and Multivariate Analysis: stay in contact with your data
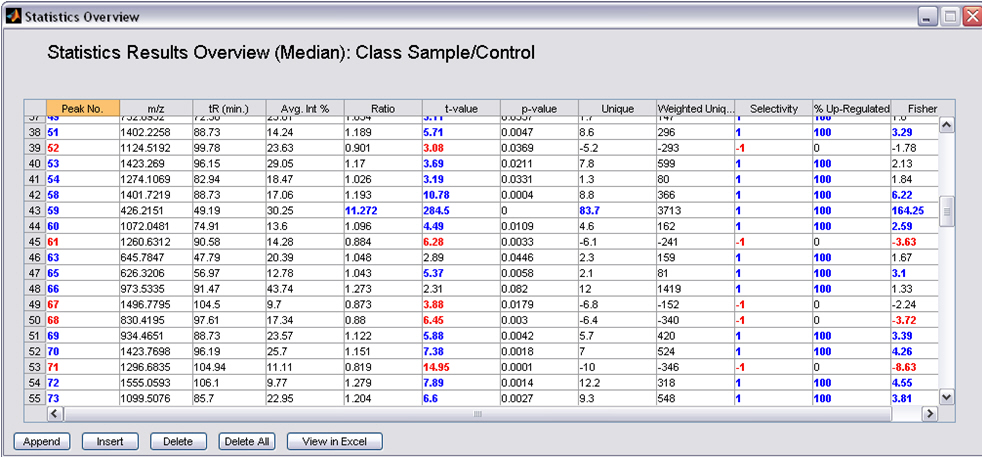
Once the Peak Picking or Peak Matching is completed you need to analyze the data for differences between groups using a combination of Univariate and Multivariate Tools. No need to call in Bioinformaticians, you can do the analysis yourself.
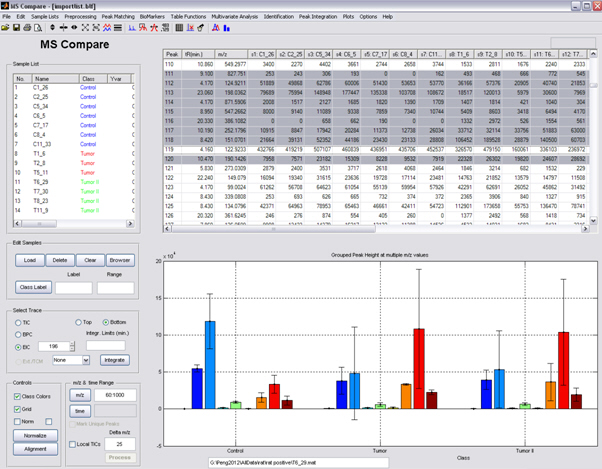
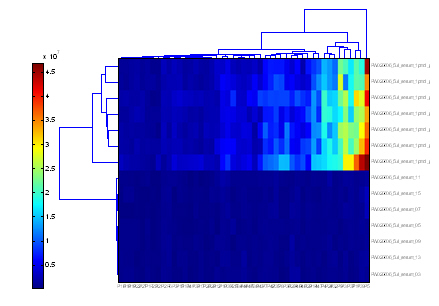
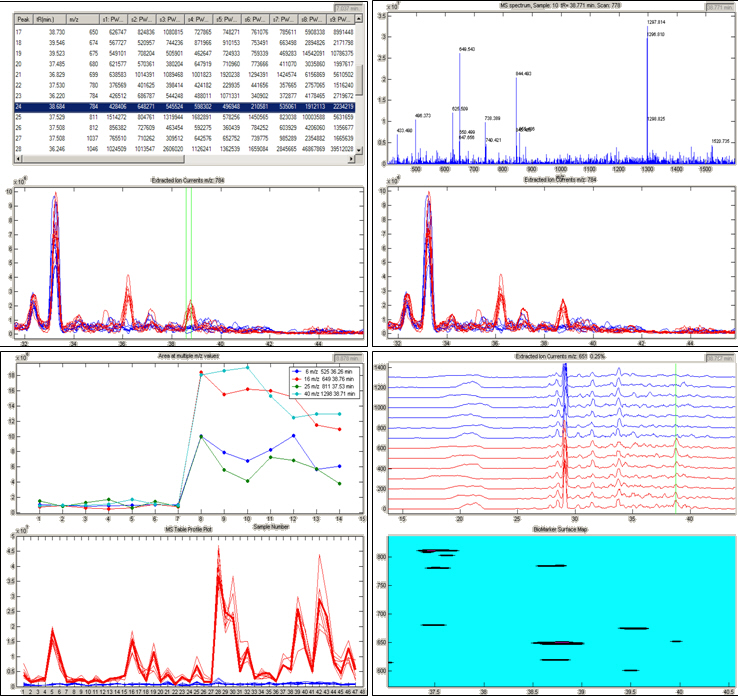
MsCompare offers all the tools to analyze the data. Results can be directly viewed on the raw LC/MS data; chromatograms and MS spectra. Be sure that the peaks are real. All multivariate techniques are highly interactive. Directly plot chromatograms and peak profiles from your loading plots.
Overview: